ASP.NET Ria Essential Pack是一个控件库,其包含了基于Silverlight的ASP.NET GridView和 ASP.NET Chart控件。这些控件均基于RIA原则:其均为通用ASP.NET控件,属性与GridView和Chart相似,但是其均是在用户的浏览器中使用内置的Silverlight控件对数据可视化。
ASP.NET Ria Essential Pack is a library that includes the Silverlight-based versions of ASP.NET GridView and ASP.NET Chart. These controls are based on the RIA principle: they are usual ASP.NET controls with properties similar to GridView and Chart, but they use the in-built Silverlight application for visualizing data in a user's browser.
该软件库提供了两种不同的版本:Ria Essential Pack Standard 和 Ria Essential Pack Professional。这两个版本之间的不同之处在于其支持的功能。以下将对二者的不同之处进行详细比较。
ASP.NET Ria Grid
RiaGridView控件能显示的数据来源可为Web页面中的表格形式数据,如对之进行选择,排序以及编辑。其基于ASP.NET以及Silverlight技术,即通过将Silverlight应用引入原来是ASP.NET组件的GridView中,这使得其可以使用Visual Studio环境中的相应功能对RiaGridView控件的相关设置进行调整。
对于数据源,用户可以使用任意控件,以应用其系统,程序集或者IEnumerable的接口。所有标准的GridView可以使用的数据源均支持RiaGridView。
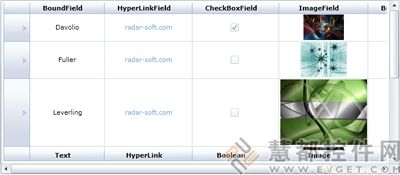
用户也可通过定义其列字段集来手动操作其列字段的显示。RiaGridView控件支持六种列字段,其可以以下形式显示数据:文本,超链接,复选框,图像或者按键。
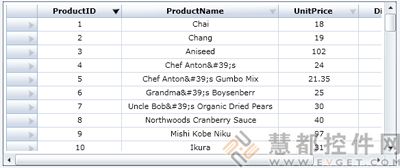
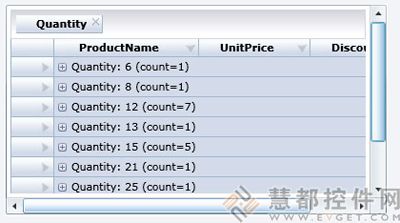
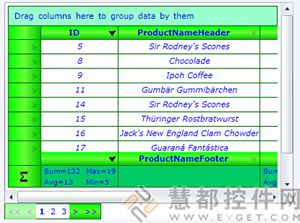
RiaGridView控件元素允许用户通过指定筛选字段的属性进行数据排序。该排序动作可以通过左击列首的矩形完成。
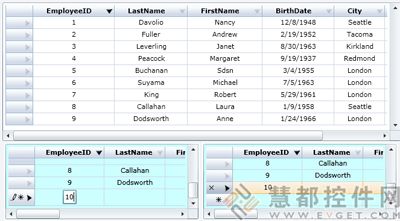
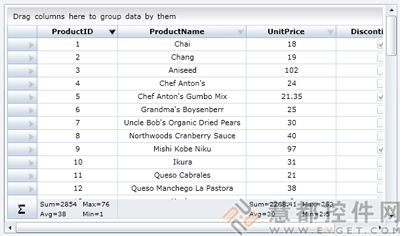
用户可对数据单元的进行单项或者多项选择,比如对之进行编辑,插入或者删除数据库记录。要选择数据单元,用户只需左击其即可,然后被选定的单元格即会改变颜色。用户还可通过使用鼠标光标指示选择区域而对数个单元格进行选定。
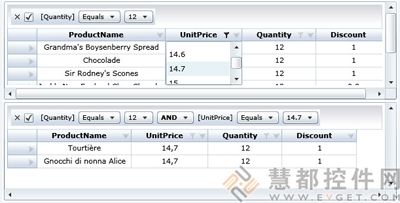
在对一个列进行的数据记录进行编辑时,软件还为绑定区域的数据提供了一个下拉列表。当用户改变其选定的值时,与RiaGridView控件绑定的数据源的相应数据也会相应改变。
ASP.NET RiaChart
用户在其Web页面中使用ASP.NET RiaChart 时,其能帮助扩展数据显示的形式为图形或者图表。RiaChart是对Microsoft的l ASP.NET图表控件的继承,其可以通过内置的Silverlight在客户的浏览器中进行显示。
- 数据绑定
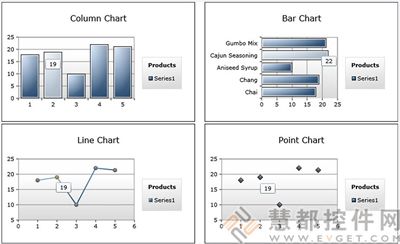
其拥有一系列内置的创建数列的方法,并能将之添加入图表中,该功能扩展了RiaChart控件数据绑定的标准选项。具备图表能力的数列一旦被创建,用户即需将之绑定至适当的图表区域,并为之选定类型(列,条,点,线,饼)。
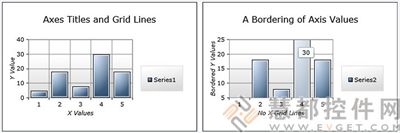
用户还可对图表的坐标轴以及相应网格的网格线显示进行操作:为坐标轴指定标签名,在图表的相应网格上指定相应的域(最大和最小的坐标值)
开发工具要求
- Visual Studio 2005 或者 2008 (推荐使用2008 ) 或者 Visual Web Developer
- .NET Framework 3.5 SP1
网络服务器要求
- NET Framework 3.5 SP1
- ASP.NET 2.0
The library is supplied in two versions: Ria Essential Pack Standard and Ria Essential Pack Professional - the difference is in the supported features. The following table details the differences between the two versions:
ASP.NET Ria Grid
The RiaGridView control allows displaying data from the data source on a web page in the form of a table, as well as selecting, sorting and editing them. It is based on both ASP.NET and Silverlight technologies, by introducing the Silverlight application into GridView, an ASP.NET component. This allows using the capabilities of the Visual Studio environment for tuning the settings of the RiaGridView control.
As a data source, you can use any control, implementing the System.Collections.IEnumerable interface. All the data sources, that a standard GridView can work with, will be allowed for RiaGridView.
You can also manipulate the display of the columns manually by defining your own column field collection. The RiaGridView control element supports six types of columns that allow displaying data as a text, a hyperlink, a checkbox, an image or a button.
- Paging, Sorting and Dragging
The RiaGridView control element allows you to sort data by the column specified in the sorting field property. The sorting is assigned by left clicking the triangle in the in the column header.
- Selection and Data Manipulation
A user has an option of single or multiple selections of data cells, as well as editing, inserting and deleting database records. To select a cell, simply left click it. The selected cell will change color. You can select several cells, by indicating the selection area with the mouse cursor.
For editing a record from a column, there is a drop-down list of data from the bound field. When you change the selected value, the data in the data source bound to the RiaGridView control changes accordingly.
ASP.NET RiaChart
Using the RiaChart control on your web page expands the options of data visualization that can be presented both as diagrams and as charts. RiaChart control is a heir of the wonderful ASP.NET Charting Control from Microsoft, that visualises it in the client's browser with the help of the in-built Silverlight application.
A set of the in-built methods of creating series and adding them to the Chart expands the standard options of data binding for the RiaChart control element. Chart Features Series are created from the source data. Then you should bind them to a diagram area and choose a type for it (Column, Bar, Point, Line, Pie).
You can also manipulate the display of diagram axes and the lines of the coordinate grid: assign label names on the axes, specify the coordinate range (the minimum and maximum values of axes) of the chart on the coordinate grid.
Developer requirements
- Visual Studio 2005 or 2008 (2008 recommended) or Visual Web Developer
- .NET Framework 3.5 SP1
Web-server requirements
- NET Framework 3.5 SP1
- ASP.NET 2.0


 首页
首页 


 相关产品
相关产品 授权相关问题
 微信
微信 在线咨询
在线咨询


 渝公网安备
50010702500608号
渝公网安备
50010702500608号

 客服热线
客服热线