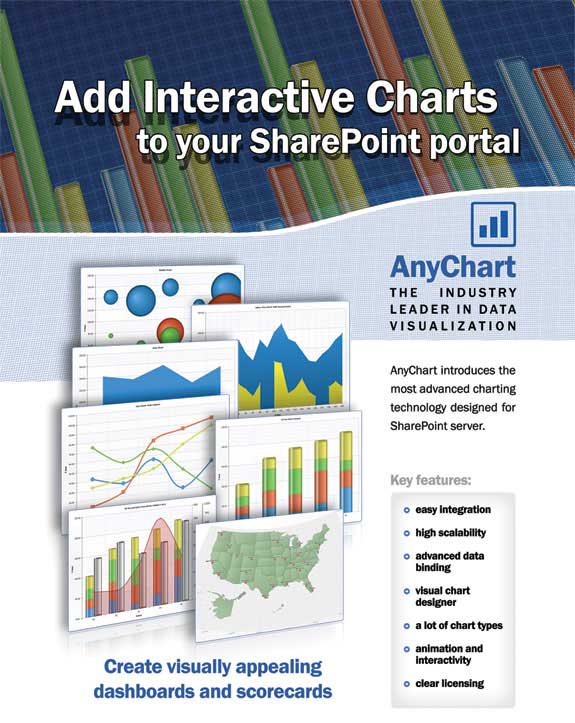
AnyChart introduces the most advanced charting technology designed for SharePoint server. Now you can add charts to your collaborative portals. This product is based on AnyChart charting engine and designed and optimized for Microsoft SharePoint. Any SharePoint user can implement charting capabilities now - simple wizard helps to configure charts quickly and easily with real-time preview and bind it to your data.
AnyChart introduces the most advanced charting technology designed for SharePoint server. Now you can add charts to your collaborative portals. This product is based on AnyChart charting engine and designed and optimized for Microsoft SharePoint. Any SharePoint user can implement charting capabilities now - simple wizard helps to configure charts quickly and easily with real-time preview and bind it to your data.
Key features:
- automatic installation
- easy integration
- high scalability
- easy data binding
- visual chart designer
- a lot of chart types
- animation effects
Based on proven Flash charting package - AnyChart
Our solution was created using proven and robust data visualization technology - AnyChart. AnyChart is a flexible Adobe Flash based solution that allows you to create interactive and great looking flash charts.
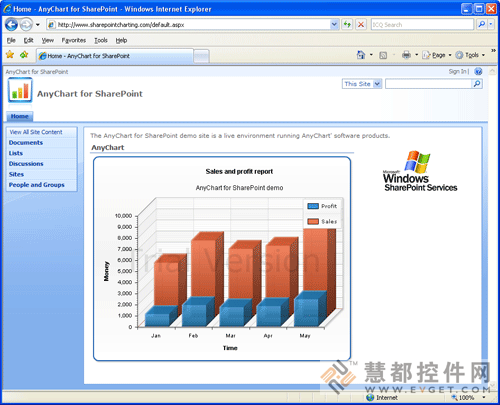
Easily installable by end-user - no server code required
AnyChart for SharePoint includes smart installation wizard that allows to install it by end-user. Installation will not affect the functionality of the Site Template Gallery.
Easy data binding
Data Binding is easy and automatic. The SharePoint chart takes data directly from the SharePoint site lists.
Visual chart designer
Step-by-step chart configuration wizard allows to customize all aspects of the visualization: chart types, titles, sub-titles, fonts, labels, legend, footer, axis titles, scales, grids, ticks, tooltips, etc. You don't have to be an expert in SharePoint to configure the chart.
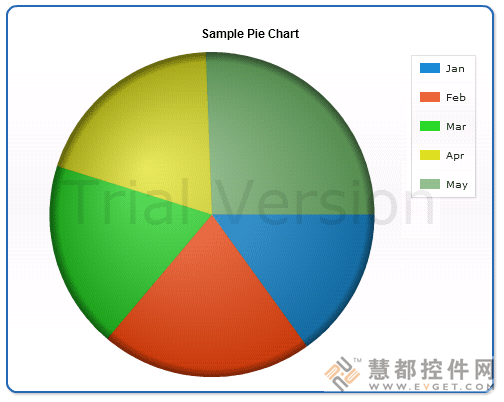
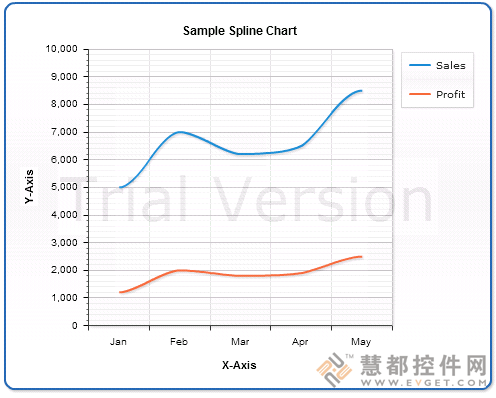
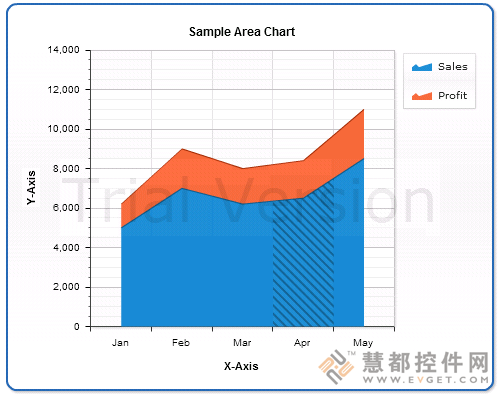
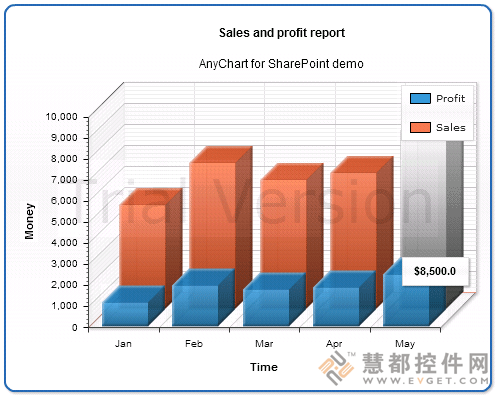
A lot of chart types
AnyChart for SharePoint includes columns, bars, lines, pyramids, cones, cylinders, areas, pies, etc. We're constantly adding new chart types.
Build Business Intelligence dashboards
Usually building BI dashboards requires expensive and complicated tools and special consulting people. Now you can build it on your own. Using AnyChart for SharePoint you can easily build and configure any dashboard in minutes. This solution intended for everybody who deals with creation of dashboard, reporting, analytics, statistical, financial or any other data visualization solutions.
Create visually appealing digital dashboards and scorecards!
Key features:
- automatic installation
- easy integration
- high scalability
- easy data binding
- visual chart designer
- a lot of chart types
- animation effects
Based on proven Flash charting package - AnyChart
Our solution was created using proven and robust data visualization technology - AnyChart. AnyChart is a flexible Adobe Flash based solution that allows you to create interactive and great looking flash charts.
Easily installable by end-user - no server code required
AnyChart for SharePoint includes smart installation wizard that allows to install it by end-user. Installation will not affect the functionality of the Site Template Gallery.
Easy data binding
Data Binding is easy and automatic. The SharePoint chart takes data directly from the SharePoint site lists.
Visual chart designer
Step-by-step chart configuration wizard allows to customize all aspects of the visualization: chart types, titles, sub-titles, fonts, labels, legend, footer, axis titles, scales, grids, ticks, tooltips, etc. You don't have to be an expert in SharePoint to configure the chart.
A lot of chart types
AnyChart for SharePoint includes columns, bars, lines, pyramids, cones, cylinders, areas, pies, etc. We're constantly adding new chart types.
Build Business Intelligence dashboards
Usually building BI dashboards requires expensive and complicated tools and special consulting people. Now you can build it on your own. Using AnyChart for SharePoint you can easily build and configure any dashboard in minutes. This solution intended for everybody who deals with creation of dashboard, reporting, analytics, statistical, financial or any other data visualization solutions.
Create visually appealing digital dashboards and scorecards!


 首页
首页 


 相关产品
相关产品 授权相关问题
 微信
微信 在线咨询
在线咨询


 渝公网安备
50010702500608号
渝公网安备
50010702500608号

 客服热线
客服热线