文档类已经添加进了新的插入图表方法,所以,让我们看看如何使用DocumentBuilder.InsertChart方法将一个简单的列图表插入到文档。
如下所示:
C#
Document doc = new Document();
DocumentBuilder builder = new DocumentBuilder(doc);

// Add chart with default data. You can specify different chart types and sizes.
Shape shape = builder.InsertChart(ChartType.Column, 432, 252);

// Chart property of Shape contains all chart related options.
Chart chart = shape.Chart;

// Get chart series collection.
ChartSeriesCollection seriesColl = chart.Series;

// Delete default generated series.
seriesColl.Clear();

// Create category names array, in this example we have two categories.
string[] categories = new string[] { "AW Category 1", "AW Category 2" };

// Adding new series. Please note, data arrays must not be empty and arrays must be the same size.
seriesColl.Add("AW Series 1", categories, new double[] { 1, 2 });
seriesColl.Add("AW Series 2", categories, new double[] { 3, 4 });
seriesColl.Add("AW Series 3", categories, new double[] { 5, 6 });
seriesColl.Add("AW Series 4", categories, new double[] { 7, 8 });
seriesColl.Add("AW Series 5", categories, new double[] { 9, 10 });

doc.Save(MyDir + @"TestInsertChartColumn.docx");
Visual Basic
Dim doc As New Document()
Dim builder As New DocumentBuilder(doc)

' Add chart with default data. You can specify different chart types and sizes.
Dim shape As Shape = builder.InsertChart(ChartType.Column, 432, 252)

' Chart property of Shape contains all chart related options.
Dim chart As Chart = shape.Chart

' Get chart series collection.
Dim seriesColl As ChartSeriesCollection = chart.Series

' Delete default generated series.
seriesColl.Clear()

' Create category names array, in this example we have two categories.
Dim categories() As String = {"AW Category 1", "AW Category 2"}

' Adding new series. Please note, data arrays must not be empty and arrays must be the same size.
seriesColl.Add("AW Series 1", categories, New Double() {1, 2})
seriesColl.Add("AW Series 2", categories, New Double() {3, 4})
seriesColl.Add("AW Series 3", categories, New Double() {5, 6})
seriesColl.Add("AW Series 4", categories, New Double() {7, 8})
seriesColl.Add("AW Series 5", categories, New Double() {9, 10})

doc.Save(MyDir & "TestInsertChartColumn.docx")
这段代码会产生如下结果:
有四种不同的加载添加方法:
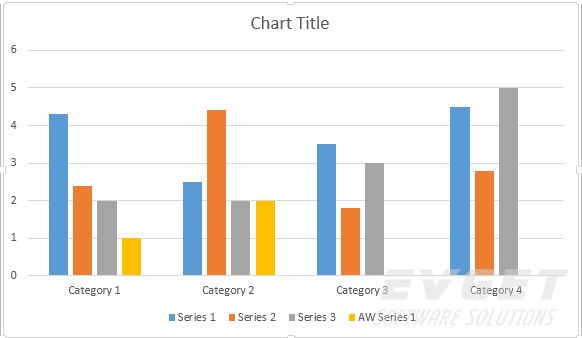
1.插入列图表
C#
Document doc = new Document();
DocumentBuilder builder = new DocumentBuilder(doc);

// Insert Column chart.
Shape shape = builder.InsertChart(ChartType.Column, 432, 252);
Chart chart = shape.Chart;

// Use this overload to add series to any type of Bar, Column, Line and Surface charts.
chart.Series.Add("AW Series 1", new string[] { "AW Category 1", "AW Category 2" }, new double[] { 1, 2 });

doc.Save(MyDir + @"TestInsertColumnChart.docx");
Visual Basic
Dim doc As New Document()
Dim builder As New DocumentBuilder(doc)

' Insert Column chart.
Dim shape As Shape = builder.InsertChart(ChartType.Column, 432, 252)
Dim chart As Chart = shape.Chart

' Use this overload to add series to any type of Bar, Column, Line and Surface charts.
chart.Series.Add("AW Series 1", New string() { "AW Category 1", "AW Category 2" }, New Double() { 1, 2 })

doc.Save(MyDir & "TestInsertColumnChart.docx")
结果如下:
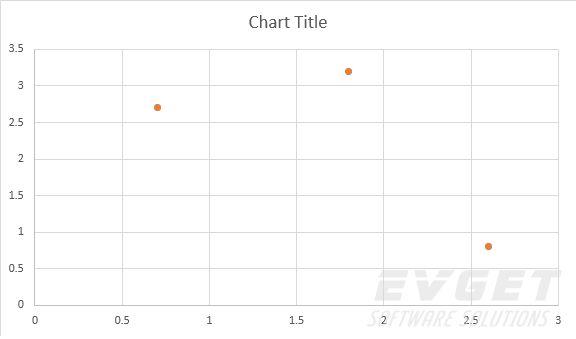
2.插入散点图
C#
Document doc = new Document();
DocumentBuilder builder = new DocumentBuilder(doc);

// Insert Scatter chart.
Shape shape = builder.InsertChart(ChartType.Scatter, 432, 252);
Chart chart = shape.Chart;

// Use this overload to add series to any type of Scatter charts.
chart.Series.Add("AW Series 1", new double[] { 0.7, 1.8, 2.6 }, new double[] { 2.7, 3.2, 0.8 });

doc.Save(MyDir + @"TestInsertScatterChart.docx");
Visual Basic
Dim doc As New Document()
Dim builder As New DocumentBuilder(doc)

' Insert Scatter chart.
Dim shape As Shape = builder.InsertChart(ChartType.Scatter, 432, 252)
Dim chart As Chart = shape.Chart

' Use this overload to add series to any type of Scatter charts.
chart.Series.Add("AW Series 1", New Double() {0.7, 1.8, 2.6}, New Double() {2.7, 3.2, 0.8})

doc.Save(MyDir & "TestInsertScatterChart.docx")
结果如下:
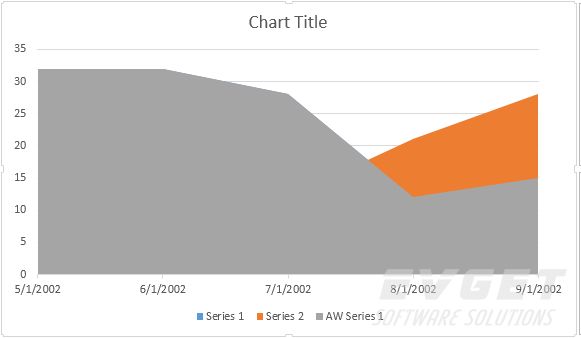
3.插入面积图
C#
Document doc = new Document();
DocumentBuilder builder = new DocumentBuilder(doc);

// Insert Area chart.
Shape shape = builder.InsertChart(ChartType.Area, 432, 252);
Chart chart = shape.Chart;

// Use this overload to add series to any type of Area, Radar and Stock charts.
chart.Series.Add("AW Series 1", new DateTime[] {
new DateTime(2002, 05, 01),
new DateTime(2002, 06, 01),
new DateTime(2002, 07, 01),
new DateTime(2002, 08, 01),
new DateTime(2002, 09, 01)}, new double[] { 32, 32, 28, 12, 15 });

doc.Save(MyDir + @"TestInsertAreaChart.docx");
Visual Basic
Dim doc As New Document()
Dim builder As New DocumentBuilder(doc)

' Insert Area chart.
Dim shape As Shape = builder.InsertChart(ChartType.Area, 432, 252)
Dim chart As Chart = shape.Chart

' Use this overload to add series to any type of Area, Radar and Stock charts.
chart.Series.Add("AW Series 1", New DateTime() {New DateTime(2002, 5, 1), New DateTime(2002, 6, 1), New DateTime(2002, 7, 1), New DateTime(2002, 8, 1), New DateTime(2002, 9, 1)}, New Double() {32, 32, 28, 12, 15})

doc.Save(MyDir & "TestInsertAreaChart.docx")
结果如下:
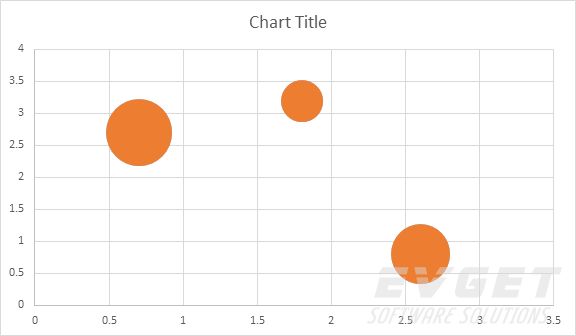
4.插入气泡式图表
C#
Document doc = new Document();
DocumentBuilder builder = new DocumentBuilder(doc);

// Insert Bubble chart.
Shape shape = builder.InsertChart(ChartType.Bubble, 432, 252);
Chart chart = shape.Chart;

// Use this overload to add series to any type of Bubble charts.
chart.Series.Add("AW Series 1", new double[] { 0.7, 1.8, 2.6 }, new double[] { 2.7, 3.2, 0.8 }, new double[] { 10, 4, 8 });

doc.Save(MyDir + @"TestInsertBubbleChart.docx");
Visual Basic
Dim doc As New Document()
Dim builder As New DocumentBuilder(doc)

' Insert Bubble chart.
Dim shape As Shape = builder.InsertChart(ChartType.Bubble, 432, 252)
Dim chart As Chart = shape.Chart

' Use this overload to add series to any type of Bubble charts.
chart.Series.Add("AW Series 1", New Double() {0.7, 1.8, 2.6}, New Double() {2.7, 3.2, 0.8}, New Double() {10, 4, 8})

doc.Save(MyDir & "TestInsertBubbleChart.docx")
结果如下:
标签:
文档管理Aspose.words
本站文章除注明转载外,均为本站原创或翻译。欢迎任何形式的转载,但请务必注明出处、不得修改原文相关链接,如果存在内容上的异议请邮件反馈至chenjj@evget.com
文章转载自:慧都控件网


 首页
首页 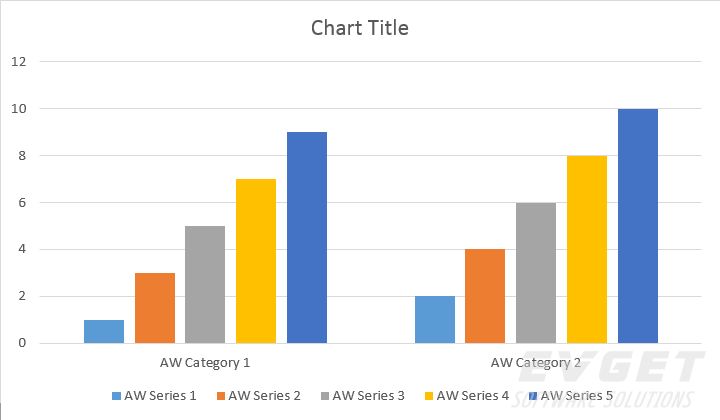


 15次
15次


 相关产品
相关产品 最新文章
最新文章 
 相关文章
相关文章 
 微信
微信 在线咨询
在线咨询


 渝公网安备
50010702500608号
渝公网安备
50010702500608号

 客服热线
客服热线