

- 首页
-
产品
- 热门推荐
- 文档管理
- 图表控件
- 数据采集
- 思维导图
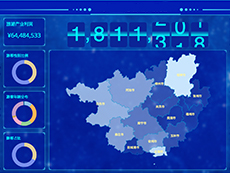
- 数据分析
- 软件测试
- 条码工具
- 3D开发工具
- 界面控件
- 开发工具
- 报表控件
- 加密解密
- 项目管理
- 数据库管理
- 腾讯云产品
没有找到合适的产品?
联系客服协助选型:023-68661681
- 解决方案
- 软件工程解决方案推动企业数字化升级和业务流程优化
-
全球开发工具Hot
提供3000多款全球软件/控件产品
- 专业咨询与服务
针对软件研发的各个阶段提供专业培训与技术咨询
- 软件开发与系统维护
根据客户需求提供定制化的软件开发服务
- 智能制造解决方案 优化生产流程和提升制造效率
-
工业3D设计(SolidWorks)
全球知名设计软件,显著提升设计质量
- 制造执行系统(Evget OMES)
打造以经营为中心,实现生产过程透明化管理
- 高级计划与排程系统(EV-APS)
帮助企业合理产能分配,提高资源利用率
- 产线MES系统(OMES ProLine)Hot
快速打造数字化生产线,实现全流程追溯
- 生产溯源系统(EV-OPTS)
生产过程精准追溯,满足企业合规要求
- 质检管理系统(EV-OQMS)
以六西格玛为理论基础,实现产品质量全数字化管理
- 看板管理系统(Getlnsight Kanban)
通过大屏电子看板,实现车间透明化管理
- 设备管理系统(EV-OTPM)
对设备进行全生命周期管理,提高设备综合利用率
- 工业数据采集(IntGather)
实现设备数据的实时采集与监控
- 石油工程解决方案 运用数字化技术提升油气勘探与钻采效率
-
油气勘探数字化 Hot
利用数字化技术提升油气勘探的效率和成功率
- 钻井工程数字化
钻井计划优化、实时监控和风险评估
- 数据管理与分析
提供业务洞察与决策支持实现数据驱动决策
- 行业
- 案例
- 培训
- 关于慧都
 首页
首页 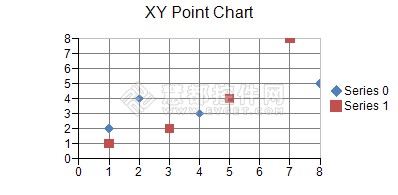


 5次
5次

 相关产品
相关产品 最新文章
最新文章 
 相关文章
相关文章 
 微信
微信 在线咨询
在线咨询


 渝公网安备
50010702500608号
渝公网安备
50010702500608号

 客服热线
客服热线